Thursday, June 10, 2010
What is ERP?
Enterprise resource planning software, or ERP, doesn’t live up to its acronym. Forget about planning—it doesn’t do much of that—and forget about resource, a throwaway term. But remember the enterprise part. This is ERP’s true ambition. It attempts to integrate all departments and functions across a company onto a single computer system that can serve all those different departments’ particular needs.
That is a tall order, building a single software program that serves the needs of people in finance as well as it does the people in human resources and in the warehouse. Each of those departments typically has its own computer system optimized for the particular ways that the department does its work. But ERP combines them all together into a single, integrated software program that runs off a single database so that the various departments can more easily share information and communicate with each other.
That integrated approach can have a tremendous payback if companies install the software correctly.
Take a customer order, for example. Typically, when a customer places an order, that order begins a mostly paper-based journey from in-basket to in-basket around the company, often being keyed and rekeyed into different departments’ computer systems along the way. All that lounging around in in-baskets causes delays and lost orders, and all the keying into different computer systems invites errors. Meanwhile, no one in the company truly knows what the status of the order is at any given point because there is no way for the finance department, for example, to get into the warehouse’s computer system to see whether the item has been shipped. "You’ll have to call the warehouse" is the familiar refrain heard by frustrated customers.
ERP vanquishes the old standalone computer systems in finance, HR, manufacturing and the warehouse, and replaces them with a single unified software program divided into software modules that roughly approximate the old standalone systems. Finance, manufacturing and the warehouse all still get their own software, except now the software is linked together so that someone in finance can look into the warehouse software to see if an order has been shipped. Most vendors’ ERP software is flexible enough that you can install some modules without buying the whole package. Many companies, for example, will just install an ERP finance or HR module and leave the rest of the functions for another day.
How can ERP improve a company’s business performance?
ERP’s best hope for demonstrating value is as a sort of battering ram for improving the way your company takes a customer order and processes it into an invoice and revenue—otherwise known as the order fulfillment process. That is why ERP is often referred to as back-office software. It doesn’t handle the up-front selling process (although most ERP vendors have developed CRM software or acquired pure-play CRM providers that can do this); rather, ERP takes a customer order and provides a software road map for automating the different steps along the path to fulfilling it. When a customer service representative enters a customer order into an ERP system, he has all the information necessary to complete the order (the customer’s credit rating and order history from the finance module, the company’s inventory levels from the warehouse module and the shipping dock’s trucking schedule from the logistics module, for example).
People in these different departments all see the same information and can update it. When one department finishes with the order it is automatically routed via the ERP system to the next department. To find out where the order is at any point, you need only log in to the ERP system and track it down. With luck, the order process moves like a bolt of lightning through the organization, and customers get their orders faster and with fewer errors than before. ERP can apply that same magic to the other major business processes, such as employee benefits or financial reporting.
That process may not have been efficient, but it was simple. Finance did its job, the warehouse did its job, and if anything went wrong outside of the department’s walls, it was somebody else’s problem. Not anymore. With ERP, the customer service representatives are no longer just typists entering someone’s name into a computer and hitting the return key. The ERP screen makes them businesspeople. It flickers with the customer’s credit rating from the finance department and the product inventory levels from the warehouse. Will the customer pay on time? Will we be able to ship the order on time? These are decisions that customer service representatives have never had to make before, and the answers affect the customer and every other department in the company. But it’s not just the customer service representatives who have to wake up. People in the warehouse who used to keep inventory in their heads or on scraps of paper now need to put that information online. If they don’t, customer service reps will see low inventory levels on their screens and tell customers that their requested item is not in stock. Accountability, responsibility and communication have never been tested like this before.
There are five major reasons why companies undertake ERP.
- Integrate financial information—As the CEO tries to understand the company’s overall performance, he may find many different versions of the truth. Finance has its own set of revenue numbers, sales has another version, and the different business units may each have their own version of how much they contributed to revenues. ERP creates a single version of the truth that cannot be questioned because everyone is using the same system.
- Integrate customer order information—ERP systems can become the place where the customer order lives from the time a customer service representative receives it until the loading dock ships the merchandise and finance sends an invoice. By having this information in one software system, rather than scattered among many different systems that can’t communicate with one another, companies can keep track of orders more easily, and coordinate manufacturing, inventory and shipping among many different locations at the same time.
- Standardize and speed up manufacturing processes—Manufacturing companies—especially those with an appetite for mergers and acquisitions—often find that multiple business units across the company make the same widget using different methods and computer systems. ERP systems come with standard methods for automating some of the steps of a manufacturing process. Standardizing those processes and using a single, integrated computer system can save time, increase productivity and reduce head count.
- Reduce inventory—ERP helps the manufacturing process flow more smoothly, and it improves visibility of the order fulfillment process inside the company. That can lead to reduced inventories of the stuff used to make products (work-in-progress inventory), and it can help users better plan deliveries to customers, reducing the finished good inventory at the warehouses and shipping docks. To really improve the flow of your supply chain, you need supply chain software, but ERP helps too.
- Standardize HR information—Especially in companies with multiple business units, HR may not have a unified, simple method for tracking employees’ time and communicating with them about benefits and services. ERP can fix that.
Carlisle FoodService Products, in Oklahoma, USA, is a leading manufacturer of professional grade tools and tableware for the foodservice industry. Carlisle sells over 50,000 products via a network of over 10,000 distributors to restaurants, hotels and hospitals worldwide. Since 1995, Carlisle has used LANSA to streamline procedures and increase ROI in virtually every area of its business. Manufacturing plants and distribution centers use LANSA ERP Frameworks and Carlisle's distributors have Web access using a LANSA site
Ken Zaleski, MIS director at Carlisle FoodService, says, "We were the first in our industry to offer our customers a functional and user friendly Web site. Being the first certainly provided us with a competitive advantage. The efficiency the site brings remains a major selling point today. With a small team, we can maintain a system used by internal users, remote sales representative offices and distributors worldwide."
Carlisle FoodService Products is part of Carlisle Companies Incorporated, a diversified global manufacturing company headquartered in Charlotte, North Carolina, USA, that serves the construction material, commercial roofing, specialty tire and wheel, power transmission, heavy-duty brake and friction, foodservice, data transmission and process systems industries. Carlisle FoodService Products has U.S. distribution centers at Oklahoma City in Oklahoma, Charlotte in North Carolina, Reno in Nevada and a distribution center in the Netherlands to serve Europe. It has manufacturing plants at Oklahoma City in Oklahoma, Atlanta in Georgia and Sparta in Wisconsin, as well as Chihuahua in Mexico. The LANSA-based systems integrate with LogPRO warehouse management system software. Carlisle FoodService Products uses a single iSeries model 810 for all its operational system, the Web site and for development. Carlisle's ERP system has 250 internal users, while 50 sales representative companies and 5,000 distributors use the Web site regularly.
The Challenge
The Carlisle FoodService Products story started in 1955, when Continental Plastics, a small custom molding shop in Oklahoma, created the world's first plastic Bains Marie. This was followed a few years later by the world's first commercial plastic beverage pitcher. Both innovations dramatically changed food storage and beverage transport.
In 1978, Continental Plastics joined the Carlisle Group of companies. In 1991, Continental Carlisle merged with SiLite Incorporated – a manufacturer of plastic foodservice products, giftware and decorative accessories.
Several other acquisitions and one more name change followed, but Carlisle's IT history took shape with the SiLite merger. Zaleski, who originally worked at SiLite, explains that after the merger in 1991, the AS/400, with a hybrid of MAPICS and a custom order entry system, became the corporate standard.
"However, MAPICS didn't fit the way we wanted to run our business," says Zaleski. "MAPICS was strong enough on the process side, but it didn't meet our requirements on the distribution side. We were modifying MAPICS so much that it made no sense to continue. Moreover, neither system was Year 2000 compliant, so we were looking for another solution."
Carlisle used LANSA since 1995. Initially for MAPICS modifications and extensions. They bought LANSA because for them it was far more productive than RPG and a lot easier to use than Synon.
They didn't want to go back to RPG or COBOL ever. And so they started to look around for a ERP solution that was written in LANSA.
In 1997, they saw a LANSA-based ERP solution, at the time called Garnet, which is now the LANSA ERP Frameworks. They said it was a very good match and it met their main requirements right out of the box. Because the framework was LANSA-based, it was very easy to modify and extend," says Zaleski.
Implementation started in 1998 and the ERP Frameworks is now used company wide at Carlisle's manufacturing and distribution centers in the USA and Mexico, where it integrates with LogPRO warehouse management software.
Why do ERP projects fail so often?
At its simplest level, ERP is a set of best practices for performing different duties in your company, including finance, HR, manufacturing and the warehouse. To get the most from the software, you have to get people inside your company to adopt the work methods outlined in the software. If the people in the different departments that will use ERP don’t agree that the work methods embedded in the software are better than the ones they currently use, they will resist using the software or will want IT to change the software to match the ways they currently do things. This is where ERP projects break down. Political fights break out over how—or even whether—the software will be installed. IT gets bogged down in long, expensive customization efforts to modify the ERP software to fit with powerful business barons’ wishes. Customizations make the software more unstable and harder to maintain when it finally does come to life. The horror stories you hear in the press about ERP can usually be traced to the changes the company made in the core ERP software to fit its own work methods. Because ERP covers so much of what a business does, a failure in the software can bring a company to a halt, literally.
But IT can fix the bugs pretty quickly in most cases, and besides, few big companies can avoid customizing ERP in some fashion—every business is different and is bound to have unique work methods that a vendor cannot account for when developing its software. The mistake companies make is assuming that changing people’s habits will be easier than customizing the software. It’s not. Getting people inside your company to use the software to improve the ways they do their jobs is by far the harder challenge. If your company is resistant to change, then your ERP project is more likely to fail.
One cautionary tale that came to light in 2008 illustrates that sometimes there is a big difference between what an ERP vendor promises to deliver in its software and what actually is ready for prime-time enterprise use. Trash-disposal company Waste Management announced in March 2008 that it was suing SAP, seeking the recovery of $100 million in project expenses that related to a failed ERP implementation that had started in 2005. In the complaint, Waste Management alleges that SAP executives participated in a fraudulent sales scheme and that SAP's Waste and Recycling ERP product was actually "fake software" that was still not ready for Waste Management's use by spring 2008.
The Solution
Carlisle sells almost exclusively to foodservice distributors, but also deals directly with very large restaurant chains such as Yum Brands, Pizza Hut and Wendy's.
In 2000, less than a year after implementing the LANSA ERP Frameworks, Carlisle gave its distributors and sales representatives real-time Web access to its ERP system. "The driving force was the vision of our president, Dave Shannon, who wanted us to have a Web presence that went beyond the static Web sites our competitors offered," explains Zaleski.
The initial version of the Web site of Carlisle took less than four months for the developer to develop and implement. Since then they have extensively enhanced the Web site with their own IT team.
Distributors and sales representatives worldwide can place orders, view inventory, switch from default to an alternate warehouse and trace shipping details, with a direct link to UPS and other carriers for package tracking.
Distributors can set up a cross-reference file that lets them link their own internal product numbers to Carlisle's product numbers, then work with either product number throughout the Web site. The solution also offers customer specific pricing, up to two years order history and a feature called 'My Favorites', where distributors can monitor inventory to maintain a minimum volume of inventory.
Distributors can search orders by their purchase order number, Carlisle's order number, date range, product number (either Carlisle's or their own), invoice number and order status.
Distributors are given one high-level user-id, which allows them to set up additional users with varying authorities. For example, some user types may view order and shipping information, but without the pricing.
The Benefits
Carlisle is the first industry to offer customers a functional and user-friendly Web site. Being the first certainly provided them with a competitive advantage. And the efficiency the site brings remains a major selling point today.
Carlisle don't expect distributors to key in their large orders on site. What they are offering is an efficient way to trace orders, look at inventory and view account details. However, distributors do use their site to place small emergency orders that they drop-ship directly to their customers, that way boosting their customer service. Small Web orders that are drop-shipped can also save their distributors a few days on cash flow. They can check in real time which orders have shipped and invoice their customers the same day. They can also get advance shipping notices by email, so their costumers don't even have to go online to check.
LANSA ERP keeps track of all their order, shipment and invoice history, and some of their smaller distributors even use their Web site as their purchase system. They also have several distributors who provide links on their Web site to their catalog. Their customers can see the products but don't see prices or inventory, because the ordering goes via the distributor.
The Web site also allows their representatives to better and more easily prepare for a business call to a customer. For example, if it has taken more than a week to fulfill a specific order, the representative now has the opportunity to find out before the meeting why there was a delay. And if needed he can make a call to the responsible manufacturing plant or supplier to speed things up. It is all about customer service," says Zaleski.
Conclusion
Their plan with the LANSA ERP Frameworks has always been to buy it and then take ownership of it, because they knew that they were going to modify it themselves, so there is no need for vendor maintenance.
Zaleski added that LANSA doesn't lock them into any specific platform, even though they love the iSeries. They never had to reboot the system because of problems. The box is very robust and so is LANSA. They have a planned reboot of the system once or twice a year, just to check their procedures and to restart some files.
They get about 600 orders per day, but a lot of their costumers are still coming in by fax. Next year they will have a look at offering their customers XML transacting with LANSA Integrator. They already offer EDI and several formats of file transfers, said Zaleski.
They have also offered their customers that if they enter orders on the Web site, they will send them a flat file back with the order information, so the costumer can import that information into their purchase system, without a need for additional data entry.
The LANSA ERP Frameworks and the Web extension are completely integrated. They run the same programs and use the same database. Any changes they make to the ERP system are instantly available in the Web extension as what Zaleski said.
Dennis Wallis, iSeries development manager at Carlisle FoodService Products, adds, "We now use LANSA for our PC applications that access a Microsoft SQL Server database, as well as for iSeries and Web development. We find LANSA easier to use than any other tool for the Windows, Web and iSeries development."
The company have only four developers, including Zaleski himself.. With that small team they maintain and enhance a system that is used by 250 internal users in their offices, plants and distribution centers, 50 remote sales representatives and 5,000 distributors worldwide. It testifies how LANSA's productivity and scalability.
Ref: http://www.cio.com/article/40323/ERP_Definition_and_Solutions#erp
![]()
.
You were tasked by the IC-dean to evaluate the enrollment system of the university, list and briefly describe the characteristics that an anlayst(you) examines when choosing or defining deployment environment.
What is system deployment?
System deployment is a complex endeavor which is a critical aspect of the software development lifecycle (SDLC), an endeavor that is all but ignored by writers in favor of sexier topics such as distributed object development, components, or the latest version of an SDK. If you can't get software into the hands of your users then what is its value? Absolutely nothing.
Deployment environments
A deployment environment is a collection of configured clusters, servers, and middleware that collaborates to provide an environment to host Service Component Architecture (SCA) interactions. For example, a deployment environment might include a host for message destinations, a processor of business events, and administrative programs.
Planning deployment environments requires that you design the physical layout (topology) of the deployment environment so you can meet your business needs for capacity, availability, scalability and failover support. Some key aspects of the design involve the number and relative placement of the servers on the hardware that makes up your deployment environment.
Planning for Deployment
It isn't enough to build software—you must also deploy it, so you can operate and support it effectively once it's in production. When you're developing complex software (the kind of systems typically tackled with component-based technologies such as J2EE or .NET), your deployment efforts can be similarly complex. Therefore, whether you're building a replacement system or plowing a fresh "greenfield" development, adequate planning is essential for successful deployment.
Step by Step
First, you must identify your system's customers. The business side includes direct users of the system, along with indirect users such as managers who receive reports based on data generated by your system. With respect to deployment, your primary technical customers are the operations and support staff, two groups who clearly need to be involved with deployment planning efforts. Once you know who your customers are, you can identify what they need from the system and related artifacts, discover their potential roles in the overall deployment effort, and negotiate their actual involvement.
The next major issue is developing your deployment strategy: Will you run the new system in parallel with the existing one or perform a cutover? Running the systems alongside each other lets you easily back out to the original system if the new one runs into problems. However, parallel operations require significant effort on the part of everyone involved: Your users will need to do double entry, the operations staff must run both systems, the support staff will have two systems to support, and the development staff may need to create integration code that temporarily works behind the scenes to synchronize data. For many systems, particularly those supporting online customers via the Internet, a cutover is the only option—few customers would be willing to place their book order with both Amazon version N and Amazon version N+1. With a straight cutover, you'll need to plan for the downtime when the cutover occurs—a period that could last from a few seconds to a few hours or even a few days, depending on the system being deployed. The ability to back out becomes critical with this approach, requiring additional resources to develop and test "de-installation scripts." In fact, many system deployment efforts fail miserably because the development team didn't consider how to back out of their new system, only to discover that they had to do so because of an unforeseen problem during installation. An effective installation routine will include go and no-go checkpoints at which you determine whether deployment efforts are on time and working smoothly. If you don't have these crucial checkpoints, you need to consider stopping and de-installing to a known and safe state from which to attempt deployment at a later date. Never assume that your deployment efforts will go smoothly.
From Back to Front
Working backward is an effective technique for deployment planning. Envision the system in production—users working with it, operations professionals keeping it going, support staff helping users to work with it, and developers modifying it to address defects and implement new requirements—and ask what has to happen to get the system to that point. Then compare that vision with the current environment to determine what you must do to successfully install your system. In my experience, forward planning generally isn't sufficient for system deployment, because the requirements often don't reflect issues pertinent to your system's production phase—that is, the need to operate and support your software is often assumed and therefore not explicitly reflected in your requirements. This problem can be exacerbated when your project life cycle doesn't explicitly include a production phase or even an operations and support workflow. What is out of sight is often out of mind.
General steps for implementing a deployment environment:
After designing a deployment environment, you will perform specific tasks to make that design a reality. Regardless which method you use to implement the deployment environment, you will perform the same general steps.
Before you begin
• Plan your topology and record the decisions you make about:
o The servers and clusters involved.
o The number of databases required.
o Which database tables belong in which databases
o Any required userids and authentication roles
o What function each cluster involved in the deployment environment provides
o Which method you are using to implement the deployment environment
• Make sure the systems on which you are installing the product meet the hardware and software requirements.
Deployment Environment Characteristics to Consider
*Compatibility with system requirements
*Compatibility among hardware and system software
*Required interfaces to external systems
*Conformity with IT strategic plan and architecture plans
*Cost and schedule
Here are some tips and technique to make it successful:
Identify and understand deployment audience. There are at least three distinct groups that need to consider: end users, the operations staff responsible for running the software once it is in production, and the support staff who is responsible for aiding your users with the software once it is in production. You need to identify the level of control that each group has over your actual deployment. Can one group stop your deployment if you don't meet their specific requirements? For example, it is quite common to discover that operations departments have defined criteria for the release of new software, criteria that your deployment approach must meet. I once worked for an organization where the users were unionized and any software that was deployed to them had to be first accepted by their union representatives, otherwise you couldn't ship. Early in your project you need to identify the deployment hoops that you need to jump through to be successful.
Identify your deployment strategy early. Will you run the new system in parallel with the existing system or will you perform a cutover? Running the system in parallel offers the advantage that you can easily back out to the original system if the new one runs into problems. However, parallel operations requires significant effort on the part of everyone involved: Your users need to do double entry, operations staff need to run both systems, support staff need to support both systems, and development staff may need to create integration code that temporarily works behind the scenes to synchronize data. For many systems, particularly ones supporting online customers via the Internet, a cutover is your only option – few customers would be willing to place their book order with both Amazon version N and with Amazon version N+1. With a straight cutover you will need to plan for a downtime period in which the cutover occurs, anywhere from a few seconds to a few hours, or even a few days depending on the nature of the system being deployed.
Installation testing. Just like you test your application, you should also test your installation scripts. A good way to do this is to develop your installation scripts as you develop your system, and use them to promote your software between your team integration sandbox into your pre-production testing environments.
Release regularly. Agile software developers typically deliver development releases at the end of each iteration into pre-production staging area(s) (see Figure 1). A development release of an application is something that could potentially be released into production if it were to be put through your pre-production quality assurance (QA), testing, and deployment processes. Granted, this won’t be true earliest development releases because you won’t have delivered sufficient functionality to make deployment worth your while. Furthermore at the beginning of a project you often stub out interfaces to shared services – such as security, persistence, or even reusable legacy functionality – so technically you still have some clean up to do before you’re ready to release to production. This is why in Figure 2 you see that the first production release often takes longer to deliver than subsequent releases; in the first release of a system you likely need to get a lot of the “plumbing” in place and your team likely hasn’t “gelled” yet enabling them to become efficient at collaboration. The first production release may take you twelve months to deliver, the second release nine months, and then other releases are delivered every six months. An early focus on deployment issues not only enables you to avoid problems it also allows you to take advantage of your experiences during development. For example, when you are deploying software into your staging area you should take notes of what works and what doesn’t, notes that can serve as the backbone of your installation scripts.
Start planning early. Deployment can be quite complex, especially when your user base is physically dispersed or there is a wide range of system configurations, you often find that you need to start planning early in your project lifecycle to be successful. There is nothing worse than rushing to finish software on time only to have it put on the shelf to await installation due to lack of deployment planning.
Recognize that deployment is harder than it looks. Regardless of whether your organization has adopted the AUP or not, the fact is that as you can see there are several activities which you need to consider when deploying a system into production.
Take an agile approach to planning. Keep your plans high-level at first, focusing on the major dependencies. The people doing the work should plan the details, and you don't need to worry about the details until you're about to do the work.
Reduce your pre-production testing efforts safely over time. It’s of little value to deliver working software on a weekly basis if there is a three-month pre-production testing process which it must go through each time. With agility you’ll find that you can reduce the amount of time invested in your pre-production testing efforts, and thereby speed up deployment. Why is this? Agilists produce high quality artifacts and have the regression test suite to prove that their system actually works. This higher level of quality implies that you’ll be able to do less testing during system deployment. Once you get really good you may find that you can in fact deploy working software into production on a weekly basis – I’ve seen this at a very large financial institution and a dot-com so it is possible, regardless of what the traditionalists may tell you.
Well-tested software is easier to deploy. Object-oriented testing is a complex and difficult endeavor, but one that you must undertake. I have several fundamental philosophies regarding testing. First, test early and test often. Two, if you can build it you can test it. Three, if it isn't worth testing it likely isn't worth building.
Your plan must reflect your organizational culture. You need to understand whom you are deploying software to, their current work practices and policies, the amount of change they are willing to tolerate, and how your software will affect them once deployed. I've found that the larger the organization the more difficult it is to deploy new software due to cultural inertia. Most people have a tendency to sit back and wait to see who else is using a product, which is often contrary to the nature of most software developers who will jump at the chance to work with new software.
Update your deployment plan regularly. This helps to set realistic expectations by both your project team and your deployment audience.
Work backwards when deployment planning. Envision the system in production – users are working with it, operations professionals are keeping it going, support staff are helping users to work with the system, and developers are potentially evolving the system to address defects and to implement new requirements – and ask what needs to occur to get me to that point. Then compare that vision with where the current environment is today, something called deployment gap analysis, to determine what needs to occur to successfully install your system. My experience is that forward planning generally isn’t sufficient when it comes to system deployment because your requirements often do not reflect issues pertinent to the production phase of your system, the need to operate and support your software is often assumed and therefore not explicitly reflected in your requirements.
Have go/no-go decision points during the installation process. A good deployment plan includes go/no-go decisions points during the installation process. If at defined times during the installation you have not reached a certain point in the overall installation process you will rollback your efforts and try to install again at a future date. This is a critical concept for projects that have very stringent deployment requirements, typically software that is replacing existing mission-critical systems that currently run your business.
Develop "de-installation" scripts. The ability to back out becomes critical with this approach, requiring investment of additional resources to develop and test de-installation scripts. In fact, many deployment efforts fail miserably because the development team didn’t bother to consider how to back out their new system, and then discovered that they had to do so because of an unforeseen problem during installation. Never assume that your deployment efforts will go smoothly.
Remember the data. Data conversion is often a key task for the deployment of a new software system, a complex effort that should be started early in your project. Analysis of your legacy data needs to be performed: the legacy data sources need to be identified, the legacy schemas should be modeled, and official sources of each attribute need to be chosen for data stored in several places. You need to understand your existing legacy data so that you can convert it to your new schema
Negotiate with legacy system owners early. During development you will discover dependencies between your system and other systems, dependencies that should appear on your deployment model. These dependencies affect your deployment plan because they imply the order in which updates to the various systems (if any) must be installed. You will need to negotiate deployment efforts with the other project teams that own the systems you have dependencies on, effectively a cross-project effort. If the interface to your system changes, or if you require new ways to access their systems, then they may also need to release all or part of their systems before yours.
Announce the deployment. You should announce the anticipated deployment schedule, including both the expected training and installation dates. Your announcement could be an email to your customers, a press release, or even advertisements on television, in magazines, or on the Internet. Release announcements are important because people want to know how the new system will affect them, if at all, and when it will affect them. Respect the fact that your deployment efforts are disrupting the lives of your stakeholders.
Hold regular release meetings. The closer you get to deployment, the greater the need to hold regular release meetings with key players involved in the actual deployment. This includes quality assurance staff to advise everyone of the testing status of your software, developers to advise you of the current rework status, operations staff to inform you of current production issues of the existing environment, and support and user management to inform you of their training statuses.
Understand the associated risks of deploying systems. Because software projects have a tendency to be delivered late and over budget, there is often spectacular pressure exerted by senior management on the project manager to forgo training. Without training, your users won't be able to effectively use your software, your operations staff won't understand how to operate your software, and your support staff will have difficulty properly supporting your system. Documentation is typically at risk on most projects, once again due to being late and over budget as well as a general lack of knowledge among developers as to how to write effective documentation. Poor documentation results in significantly higher maintenance and support costs for your system. The greatest risk is often data conversion, a very complex and critical task that is often ignored until it is too late.
Don't underestimate the opportunities for reuse. Other projects may have already developed deployment models that reflect your target platform, models that you can evolve as needed for your own use (ideally your enterprise architects should be able to provide these models). Furthermore, templates for deployment plans, installation procedures, and templates for operations, user, and support documentation can also be reused from other projects. Remember, you can reuse more than just code.
You may need to upgrade your user's existing environments. These upgrades could include changes to existing hardware, operating systems, databases, or middleware. If you don’t know the current status of your technical environment you will also need to plan for activities to perform the required legacy analysis. If you are upgrading your database, you may be upgrading the database software itself or the schema of your database, you will need to include data conversion activities in your deployment plan. Physical considerations should also be considered when performing environment upgrades. Is sufficient power available? Are working areas such as desks and cubicles in place? Does sufficient room exist in the building(s) that you are deploying to? Do sufficient network drops exist for new workstations?
Training is an important part of deployment. Remember that your stakeholders may need training beyond that of learning how to work with your application. For example, this may be the first time that some users are working with a PC, a browser, or even a mouse. Similarly, this may be the first time that your operations staff is working with a new technology that your system users, such as an EJB application server, and therefore will need to be trained and educated in that technology to qualify them to work with your system.
Develop supporting documentation. Another important effort is the development of operations, support, and user documentationDepending on your corporate documentation standards you will likely find that you need to include one or more technical writers on your team to develop this documentation (hopefully in an agile manner).
Ref: http://publib.boulder.ibm.com/infocenter/dmndhelp/v7r0mx/index.jsp?topic=/com.ibm.websphere.wps.doc/doc/tpln_implementnd.html
http://www.drdobbs.com/architecture-and-design/184414753;jsessionid=N4NQLCW02PCZTQE1GHOSKH4ATMY32JVN?cid=Ambysoft
http://www.ambysoft.com/essays/deploymentTips.html
The Data Flow Diagram is the most commonly used process model. A Data Flow Diagram is a graphical system model that shows all of the main requirements for an information system in one diagram; inputs and outputs, processes and data storage. Everyone working on a development project can see all aspects of the system working together at once with the DFD. DFD is also easy to read because it is a graphical model and because there are only five symbols to learn. End users, management and all information systems workers typically can read and interpret the DFD with minimal training.
In evaluating DFD quality, a high-quality set of DFD is readable, is internally consistent and accurately represents system requirements. Accuracy of representation is determined primarily by consulting users and other knowledgeable stakeholders. A project team can ensure readability and internal consistency by applying a few simple rules to DFD construction. Analysts can apply these rules while developing the DFDs or during a separate quality check after preparing DFD drafts.
An analyst must know how to minimize complexity. People have a limited ability to manipulate complex information. If too much information is presented at once, people experience a phenomenon called information overload. When information overload occurs, a person has difficulty in understanding. The key to avoiding information overload is to divide information into small and relatively independent subsets. Each subset should contain a comprehensible amount of information that people can examine and understand in isolation. A layered set of DFDs is an example of dividing a large set of information into small independent subsets. Each subset can be examined in isolation. The reader can find additional detail about a specific process by moving down to the next level or find information about how a DFD relates to other DFDs by examining the next-higher level of DFD.
An analyst can avoid information overload within any single DFD by following two simple rules of DFD construction: the 7 + 2 and interface minimization. The rule of 7 + 2 also known as Miller’s Number derives from psychology research which shows that the number of information ‘chunks ’ that a person can remember and manipulate at one time varies between five and nine. A larger number of chunks causes information overload. Information chunks can be many things including names, words in a list, digits or components of a picture. Some application of the rule of 7 + 2 to DFDs includes the following: that a single DFD should have no more than 7 + 2 processes, no more than 7 + 2 data flow should enter or leave a process, data store or data element of a single DFD. These rules are general guidelines not unbreakable laws, DFDs that violate these rule may still be readable but violations should be considered a warning of potential problems.
Minimization of interfaces is directly related to 7 + 2. An interface is a connection to some other part of a problem or description. As with information chunks, the number of connections that a person can remember and manipulate is limited, so the number of connections should be kept to a minimum. Processes on DFD represent chunks of business or processing logic. They are related to other processes, entities and data stores by data flows. A single process with a large number of interfaces maybe too complex to understand. This complexity may show up directly on aprocess decomposition as a violation of the rule 7 + 2. An analyst can usually correct the problem by dividing the process into two or more subprocesses,each of which should have fewer interfaces.
Pairs or groups of processes with a large number of data flows between them are another violation of the interface minimization rule. Such a condition usually indicates a poor partitioning of processing tasks among the processes. The way to fix the problem is to reallocate the processing tasks so that fewer interfaces are required. The best division of work among processes is the simplest and the simplest division is one that requires the fewest interfaces amongprocesses.
An analyst can detect errors and emissions in a set of DFDs by looking for specific types of inconsistency. Three common and easily identifiable consistency erros as follows; differences in data flow content between a process and its process decomposition, data outflows w/o corresponding data inflows, data inflows w/o corresponding outflows. A process of decomposition shows te internal details of a higher level process ina more detailed form. In most cases, the data content of flows to and from a processes at one DFD level shuld be equivalent to the content of data flows to and from all processes in a decomposition. The equivalency is called balancing and the higher level DFD and the process decomposition DFD are said to be in balance. Data flow names can vary among levels for a number of reasons including decomposition of one combined data flow into several smaller flows. Thus, the analyst must be careful to look at the components of data flows,not just data flow names. For this reason, detailed analysis of balancing should not be undertaken until data flows have been fully defined. Unbalance DFDs may be acceptable when the imbalance is due to data flows that were ignored at the higher levels. For example, diagram 0 for a large system usually ignores details of error handling such as when an item is ordered but it is later determined to be out of stock and discontinued by its manufacturer.
Anothertype of DFD inconsistency can occur between data inflows and outflows of a single process or data store. By definition, a process transforms data inflows and data outflows. Analysts sometimes can spot black holes nad miracles simply by examining the DFD in other cases, close examination of data dictionary or process descriptions is required.
In a logical DFD, data should not be needlessly passed into process. The following consistency rules canbe derived from these facts: that all data flows into a process must flow out of the process or be used to generate data that flows out the process, all data that flows out process must have flowed into the process or have been generated from data that flowed into process.
DFD have symbols and these are; Consist of the following entities, data store number and name of data store. The function of data store is to designate the storage of data in a dfd diagram.
• The square is an external agent (a person or organization, outside the boundary of a system that provides data inputs or accepts data outputs)
• The rectangle with rounded corners is a process (named “Look up item available” and can be referred to by its number, 1)
• A process defines rules (algorithms or procedures) for transforming inputs into outputs
• The lines with arrows are data flows (represents movement of data). Slide shows two data flows between Customer and process 1: a process input “Item inquiry” and process output named “Item availability details”
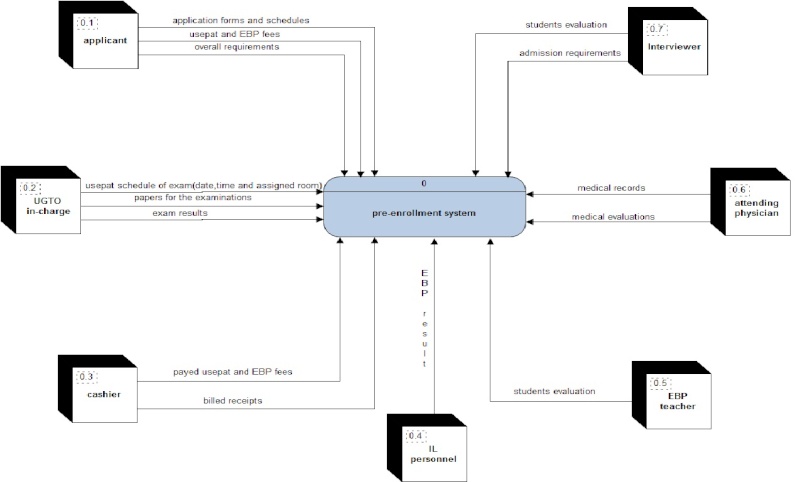
• The flat three-sided rectangle is a data store (a file or part of a database that stores information about data entity)
Data flow is a collection of data elements . Data flow definition is a textual description of data flow’s content and internal structure. Lists all the elements, e.g. a “New Order” data flow consists of Customer–Name, Customer-Address, Credit-Card-Information, Item-Number and Quantity. Often coincide with attributes of data entities included in ERD plus computed values. Algebraic notion is alternative to the list. Describes data elements on data flow plus data structure.
Data type description can be a String, integer, floating point, Boolean. Sometimes very specific written description e.g., special codes (e.g. code A means ship immediately, code B – hold for one day and code C – hold shipment pending confirmation). Length of element (usually for strings). Maximum and minimum values (for numeric values). Data dictionary – repository for definitions of data flows, data stores, and data elements.
A data store on the DFD represents a data entity on the ERD (so, no separate definition is needed, just a note referring to the ERD for details). If a data store are not linked to an ERD, a definition is provided as a collection of elements (like did for data flows).
Guidelines/Gumption Traps:
(Places where DFDing can go astray)
1. System boundary establishment is an important judgment call. External entities aid in determining where the boundary is established. An interfacing system can be shown as an external entity. It may be necessary to dictate the input of the external entity to assure system control. For example, customers may be required to submit orders or refund requests containing specific information which may require that the system aid in completion of a form. Use of output such as reports by management may re quire some agreement on tactics to be performed which may mean the entity becomes part of the system, not external to it. When in doubt, include the external entity as processes within the system and then evaluate with those concerned.
2. Label your processes carefully and vividly. A process that is labeled "Produce Report" and has the output of "Report" tells a reviewer very little. If you have trouble labeling anything on the diagram, it often is because you do not have adequate un derstanding. Choose names carefully.
3. Think logical, not physical. Ignore media, color, font, layout, packaging, time, sequencing, etc. Think "what", not "how". Something logical can be implemented physically in more than one way. Including "when" and "where" and "how" means you are g etting physical.
4. Think data, not control, flow. Data flows are pathways for data. Think about what data is needed to perform a process or update a data store. A data flow diagram is not a flowchart and should not have loops or transfer of control. Think about the data flows, data processes, and data storage that are needed to move a data structure through a system.
5. Concentrate first on what happens to a "good" transaction. Systems people have a tendency to lose sight of the forest because they are so busy concentrating on the branches of the trees.
6. Reviewers will not be convinced by confusion. A quality data flow diagram will be so simple and straightforward that people will wonder what took you so long.
7. Data store to data store, external entity to external entity, or external entity to data store connection usually do not make sense. Data flows with an arrowhead on each end cause confusion in labeling. Do not use them.
8. Do not try to put everything you know on the data flow diagram. The diagram should serve as index and outline. The index/outline will be "fleshed out" in the data dictionary, data structure diagrams, and procedure specification techniques.
What are some of the advantages of using DFD analysis? Here are several:
• Data flows and process consequences. Note how this representation of the data characteristics of banking operations enables us to start at any point in the operation (e.g., deposits, withdrawals, or bill payment), and follow the consequences of that activity through to the point where all appropriate account balances have been adjusted and reconciled. Wherever we start in the process, we can understand the processing steps that the bank would need to take to complete the relevant transaction(s) and to inform its constituents of the results.
• Data inputs and outputs. The DFD also makes it possible to understand what data are needed to provide appropriate inputs to any processing step. If, for example, we were to build an information system to support this individual's banking activities (in the days before Quicken and/or Microsoft Money), we would need to understand exactly what data items are represented by data flows such as "Monthly Statement", "Pay earned", "Withdraw or transfer", and other arrows shown in the diagram.
• Simplifying complexity by isolating process components. Note how the DFD would make it easier to capture the detail of such data flows. By isolating "Withdraw or Transfer" within the larger scheme of the banking process, the DFD makes it possible to consider the details of the data items included in this flow without reference to the flows affecting other processing steps. All of the flows affecting withdrawals (e.g., processing step 3.0, "Withdraw funds from account") are isolated as entering or leaving processing step 3.0. At the time that DFDs were developed, this shift towards modularizing data flows and processing elements represented a major step forward in enabling systems analysts to add useful structure to process representations rapidly and easily.
Disadvantages of data flow diagram
• DFD is likely to take many alteration before agreement with the user
• Physical consideration are usually left out
• It is difficult to understand because it ambiguous to the user who have little or no knowledge
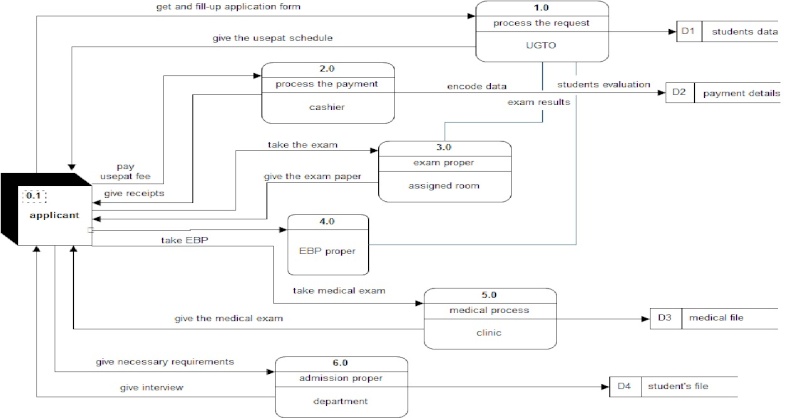
Step in drawing dfd diagrams
1. Make a list of all business activities and use it to determine the various external entities, data flows, process and data store
2. Create a context diagram which shows external entity and data flows to and from the system
3. Do not show any detailed process or data store
4. Draw diagram zero or the next level to show process but keep them general. Show data stores and the level
5. Create a child diagram for each of the process in diagram zero
6. Check for errors and make sure the levels you assign to each process and data flow are meaningful
7. Develop a physical dfd diagram from the logical dfd and distinguish between the manual and automated protocol, describe actual files and report by name and controls to indicate when the process are complete or errors occurs
8. Portion the physical DFD by separating or grouping parts of the diagram in order to facilitate programming and implementation
How to develop Logical data flow diagram
Below are the guidelines in developing data flow diagrams
1. Develop a physical dfd
2. Explore the process for more details
3. Maintain consistency between the process
4. Following meaningful leveling convention
5. Ensure that dfd diagrams clarifies what is happening in the system
6. Remember dfd audience
7. Add control on the lower level dfd only
8. Assign meaningful level
9. Evaluate dfd for correctness
Dos and Don’ts of external entity
• External entity never communicate with each other, this signify that there is no need for the process
• External entity should not communicate directly with data store because external entities can be identifier with the record of files and databases
Evaluating Data Flow Diagrams for Correctness
It is essential to evaluate all DFDs carefully to determine if they are correct. Errors, omissions and inconsistencies can occur for several reasons, including mistakes in drawing the diagrams. But the presence of what appears to be an error may in fact point out a deficiency in the system or a situation in which users are not aware of how certain processes operate.
These questions are useful in evaluating data flow diagrams:
•Are there any unnamed components in the data flow diagram (data flows, processes, stores, inputs or outputs)?
•Are there any data stores that are input but never referenced?
•Are there any processes that do not receive input?
•Are there any processes that do not produce output?
•Are there any processes that serve multiple purposes? If so, simplify by exploding them into multiple processes that can be better studied).
•Are there data stores that are never referenced?
•Is the inflow of data adequate to perform the process?
•Is there excessive storage of data in a data store (more than the necessary details)?
•Is the inflow of data into a process too much for the output that is produced?
•Are aliases introduced in the system description?
•Is each process independent of other processes and dependent only on the data it receives as input?
Diagramming mistakes: Black holes, grey holes, and miracles
A second class of DFD mistakes arise when the outputs from one processing step do not match its inputs. It is not hard to list situations in which this might occur:
• A processing step may have input flows but no output flows. This situation is sometimes called a black hole [3].
• A processing step may have output flows but now input flows. This situation is sometimes called a miracle.
• A processing step may have outputs that are greater than the sum of its inputs - e.g., its inputs could not produce the output shown. This situation is sometimes referred to as a grey hole.
When one is trying to understand a process during the course of an interview (and consequently drafting DFDs at high speed), it is not hard to develop diagrams with each of the above characteristics. Indeed, scanning DFDs for these mistakes can raise questions that provide questions for use in further process analyses (e.g., "Where do you get the data that allows you to do such-and-such...").
DFDs are not flow charts
A last class of DFD mistakes are somewhat more difficult to identify. Many of us have had prior experience developing flow charts. Flow chart diagrams can be useful for describing programming logic or understanding a single sequence of process activities. It is important to recognize, however, that DFDs are not flow charts. Flow charts often show both processing steps and data "transfer" steps (e.g., steps that do not "process" data); DFDs only show "essential" processing steps. Flow charts might (indeed, often do) include arrows without labels: DFDs never show an unnamed data flow. Flow charts show conditional logic; DFDs don't (the conditional decisions appear at lower levels, always within processing steps). Flow charts show different steps for handling each item of data; DFDs might include several data items on a single flow arrow.
Data flow diagrams can assist in
• Isolating the component parts of a business process, reducing the analytical complexity involved in determining the specifications that process support software would have to meet.
• Shifting the focus of a process description to the data flows and processing steps that the process represents.
• Identifying data-related process characteristics that could be candidates for process design improvements.
• Identifying data stores that isolate entities that could be further developed using entity-relationship analysis.
General Data Flow Rules
1. Entities are either 'sources of' or 'sinks' for data input and outputs - i.e. they are the originators or terminators for data flows.
2. Data flows from Entities must flow into Processes
3. Data flows to Entities must come from Processes
4. Processes and Data Stores must have both inputs and outputs (What goes in must come out!)
5. Inputs to Data Stores only come from Processes.
6. Outputs from Data Stores only go to Processes.
ref: http://books.google.com.ph/books?id=-ot62DeCKO4C&pg=PA234&lpg=PA234&dq=characteristics+of+an+analyst+in+evaluating+dfd&source=bl&ots=V0yZMyRzSx&sig=1mBZj2FGtrLcwIjEzazBzwQNmDM&hl=tl&ei=8RURTIKEKca5rAffh4jaBA&sa=X&oi=book_result&ct=result&resnum=5&ved=0CCkQ6AEwBA#v=onepage&q=characteristics%20of%20an%20analyst%20in%20evaluating%20dfd&f=false
Data Flow Diagram-a network representation of a system. The system may be automated, manual, or mixed. The DFD portrays the system in terms of its component pieces, with all interfaces among the components indicated. by:Tom DeMarco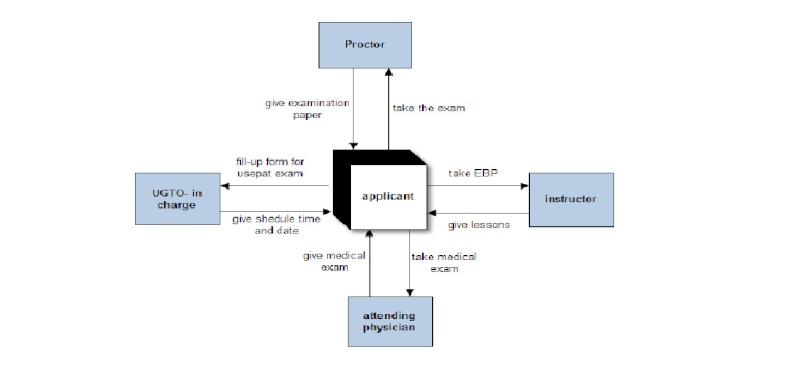


In order to admit in the university, the applicant should first take the USEPAT exam and above are the steps for scheduling.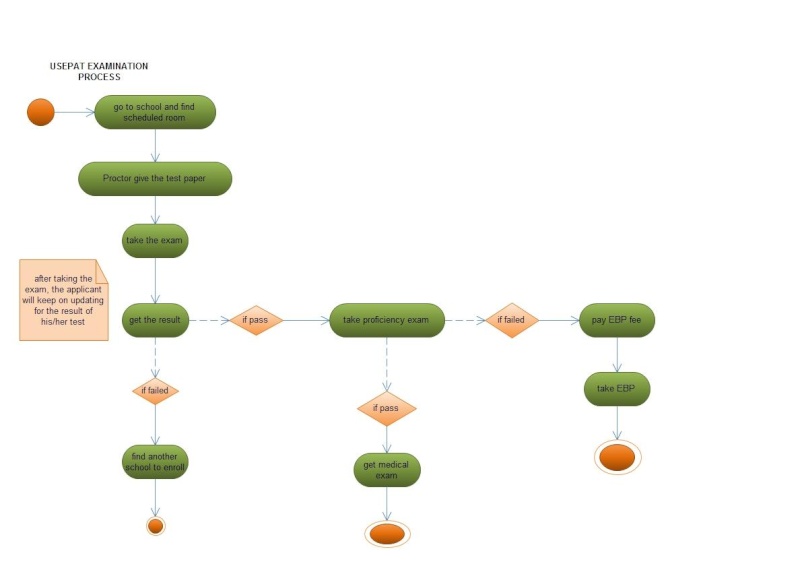
After scheduling, entrance examination is to be done to know if the applicant is qualifies to enroll in the university or not.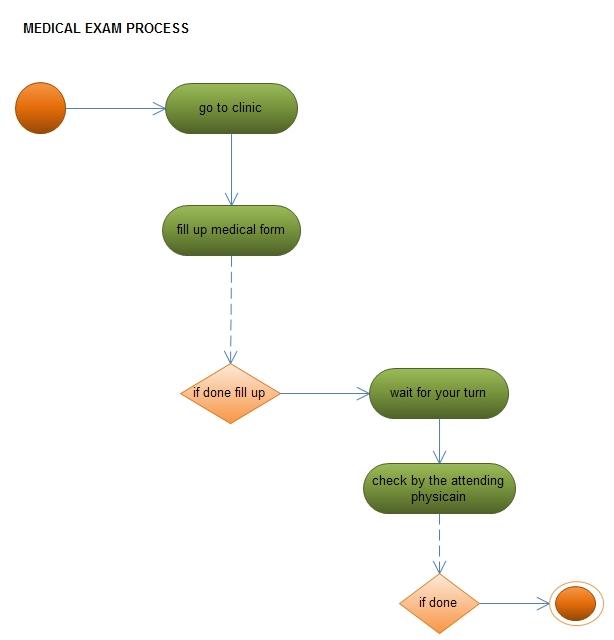
This activity diagram is for the medical examination. This will takes place either during admission or during EBP.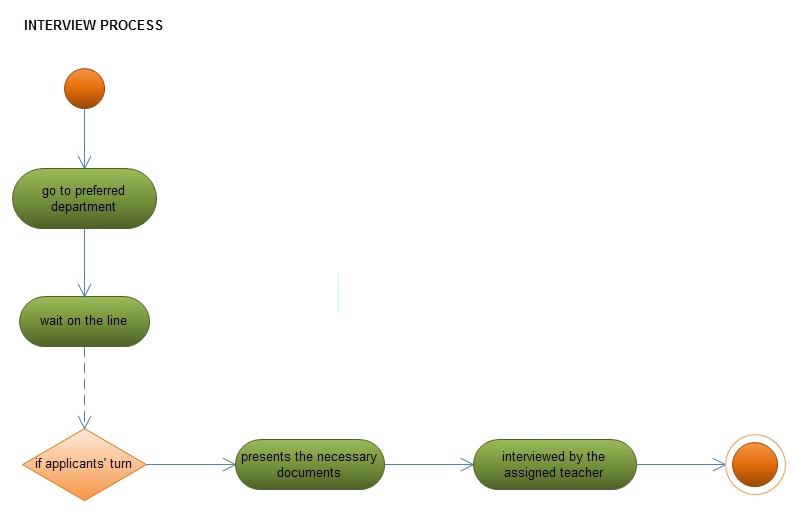
This activity diagram is for the interview process wherein the applicant is interviewed in the department he/she preferred to enroll.